Detect and react intelligently to changes in data with Drasi
This introductory post will focus on the core concepts of Drasi, and its major components such as Sources.

This article helps you to understand what to monitor if you have a Node.js application in production, and how to use Prometheus – an open source solution, which provides powerful data compressions and fast data querying for time series data – for Node.js monitoring.
If you want to learn more about Node.js and reliability engineering, check out this free whitepaper from RisingStack.
The term “service monitoring,” means tasks of collecting, processing, aggregating, and displaying real-time quantitative data about a system.
Monitoring gives us the ability to observe our system’s state and address issues before they impact our business. Monitoring can also help to optimize our users’ experience.
To analyze the data, first, you need to extract metrics from your system — like the Memory usage of a particular application instance. We call this extraction instrumentation.
We use the term white box monitoring when metrics are provided by the running system itself. This is the kind of Node.js monitoring we’ll be diving into.
Every service is different, and you can monitor many aspects of them. Metrics can range from low-level resources like Memory usage to high-level business metrics like the number of signups.
We recommend you to watch these metrics for all of your services:
You can instrument your system manually, but most of the commercial monitoring solutions provide out of the box instrumentations.
In many cases, instrumentation means adding extra logic and code pieces that come with a performance overhead.
With Node.js monitoring and instrumentation, you should aim to achieve low overhead, but it doesn’t necessarily mean that a bigger performance impact is not justifiable for better system visibility.
Instrumentations can be very specific and usually need expertise and more development time. Also, a bad instrumentation can introduce bugs into your system or generate an unreasonable performance overhead.
Instrumenting your code can also produce a lot of extra lines and bloat your applications codebase.
When your team picks a monitoring tool you should consider the following factors:
Based on our experience, in most of the cases an out-of-the-box SaaS or on-premises monitoring solution like Trace gives the right amount of visibility and toolset to monitor and debug your Node.js applications.
But what can you do when you cannot choose a commercial solution for some reason, and you want to build your own monitoring suite? In this case, Prometheus comes into the picture!
Prometheus is an open source solution for Node.js monitoring and alerting. It provides powerful data compressions and fast data querying for time series data.
The core concept of Prometheus is that it stores all data in a time series format. Time series is a stream of immutable time-stamped values that belong to the same metric and the same labels. These labels cause the metrics to be multi-dimensional.
Prometheus uses the HTTP pull model, which means that every application needs to expose a GET /metrics endpoint that can be periodically fetched by the Prometheus instance.
Prometheus has four metrics types:
In the following snippet, you can see an example response for the /metrics endpoint. It contains both the counter (nodejs_heap_space_size_total_bytes) and histogram (http_request_duration_ms_bucket) types of metrics:
# HELP nodejs_heap_space_size_total_bytes Process heap space size total from node.js in bytes.
# TYPE nodejs_heap_space_size_total_bytes gauge
nodejs_heap_space_size_total_bytes{space="new"} 1048576 1497945862862
nodejs_heap_space_size_total_bytes{space="old"} 9818112 1497945862862
nodejs_heap_space_size_total_bytes{space="code"} 3784704 1497945862862
nodejs_heap_space_size_total_bytes{space="map"} 1069056 1497945862862
nodejs_heap_space_size_total_bytes{space="large_object"} 0 1497945862862
# HELP http_request_duration_ms Duration of HTTP requests in ms
# TYPE http_request_duration_ms histogram
http_request_duration_ms_bucket{le="10",code="200",route="/",method="GET"} 58
http_request_duration_ms_bucket{le="100",code="200",route="/",method="GET"} 1476
http_request_duration_ms_bucket{le="250",code="200",route="/",method="GET"} 3001
http_request_duration_ms_bucket{le="500",code="200",route="/",method="GET"} 3001
http_request_duration_ms_bucket{le="+Inf",code="200",route="/",method="GET"} 3001
Prometheus offers an alternative, called Pushgateway, to monitor components that cannot be scrapped because they live behind a firewall or are short-lived jobs.
Before a job gets terminated, it can push metrics to this gateway, and Prometheus can scrape the metrics from there later on.
To set up Prometheus to periodically collect metrics from your application check out the following example configuration.
When we want to monitor our Node.js application with Prometheus, we need to solve the following challenges:
To collect metrics from our Node.js application and expose it to Prometheus we can use the prom-client npm library.
In the following example, we create a histogram type of metrics to collect our APIs’ response time per routes. Take a look at the pre-defined bucket sizes and our route label:
 // Init
 const Prometheus = require('prom-client')
 const httpRequestDurationMicroseconds = new Prometheus.Histogram({
 name: 'http_request_duration_ms',
 help: 'Duration of HTTP requests in ms',
 labelNames: ['route'],
 // buckets for response time from 0.1ms to 500ms
 buckets: [0.10, 5, 15, 50, 100, 200, 300, 400, 500]
 })
We need to collect the response time after each request and report it with the route label.
// After each response
 httpRequestDurationMicroseconds
 .labels(req.route.path)
 .observe(responseTimeInMs)
We can then register a route a GET /metrics endpoint to expose our metrics in the right format for Prometheus.
// Metrics endpoint
 app.get(‘/metrics’, (req, res) => {
 res.set(‘Content-Type’, Prometheus.register.contentType)
 res.end(Prometheus.register.metrics())
 })
After we collected our metrics, we want to extract some value from them to visualize.
Prometheus provides a functional expression language that lets the user select and aggregate time series data in real time.
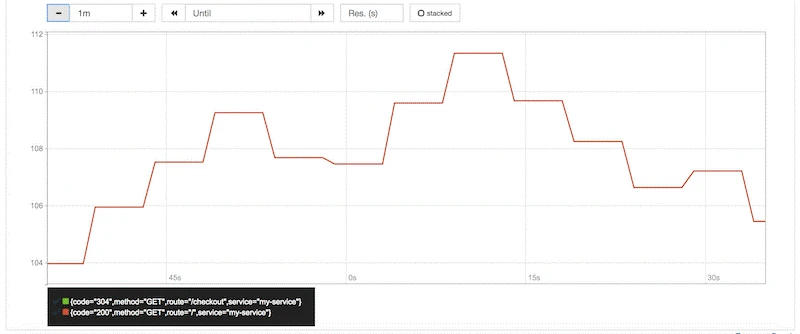
The Prometheus dashboard has a built-in query and visualization tool:

Let’s look at some example queries for response time and memory usage.
We can determinate the 95th percentile of our response time from our histogram metrics. With the 95th percentile response time, we can filter out peaks, and it usually gives a better understanding of the average user experience.
histogram_quantile(0.95, sum(rate(http_request_duration_ms_bucket[1m])) by (le, service, route, method))
As histogram type in Prometheus also collects the count and sum values for the observed metrics, we can divide them to get the average response time for our application.
avg(rate(http_request_duration_ms_sum[1m]) / rate(http_request_duration_ms_count[1m])) by (service, route, method, code)
For more advanced queries like Error rate and Apdex score check out our Prometheus with Node.js example repository.
Prometheus comes with a built-in alerting feature where you can use your queries to define your expectations. However, Prometheus alerting doesn’t come with a notification system. To set up one, you need to use the Alert manager or another external process.
Let’s see an example of how you can set up an alert for your applications’ median response time. In this case, we want to fire an alert when the median response time goes above 100ms.
# APIHighMedianResponseTime
 ALERT APIHighMedianResponseTime
 IF histogram_quantile(0.5, sum(rate(http_request_duration_ms_bucket[1m])) by (le, service, route, method)) > 100
 FOR 60s
 ANNOTATIONS {
 summary = "High median response time on {{ $labels.service }} and {{ $labels.method }} {{ $labels.route }}",
 description = "{{ $labels.service }}, {{ $labels.method }} {{ $labels.route }} has a median response time above 100ms (current value: {{ $value }}ms)",
 }

Prometheus offers a built-in Kubernetes integration, supported inside Azure Container Service as well. It’s capable of discovering Kubernetes resources like Nodes, Services, and Pods while scraping metrics from them.
It’s an extremely powerful feature in a containerized system, where instances are born and die all the time. With a use case like this, HTTP endpoint-based scraping would be hard to achieve through manual configuration.
You can also provision Prometheus easily with Kubernetes and Helm. It only needs a couple of steps.
To start, we need a running Kubernetes cluster! As Azure Container Service provides a hosted Kubernetes, I can provision one quickly:
# Provision a new Kubernetes cluster
 az acs create -n myClusterName -d myDNSPrefix -g myResourceGroup --generate-ssh-keys --orchestrator-type kubernetes
# Configure kubectl with the new cluster
 az acs kubernetes get-credentials --resource-group=myResourceGroup --name=myClusterName
After a couple of minutes when our Kubernetes cluster is ready, we can initialize Helm and install Prometheus:
helm init helm install stable/prometheus
For more information on provisioning Prometheus with Kubernetes check out the Prometheus Helm chart.
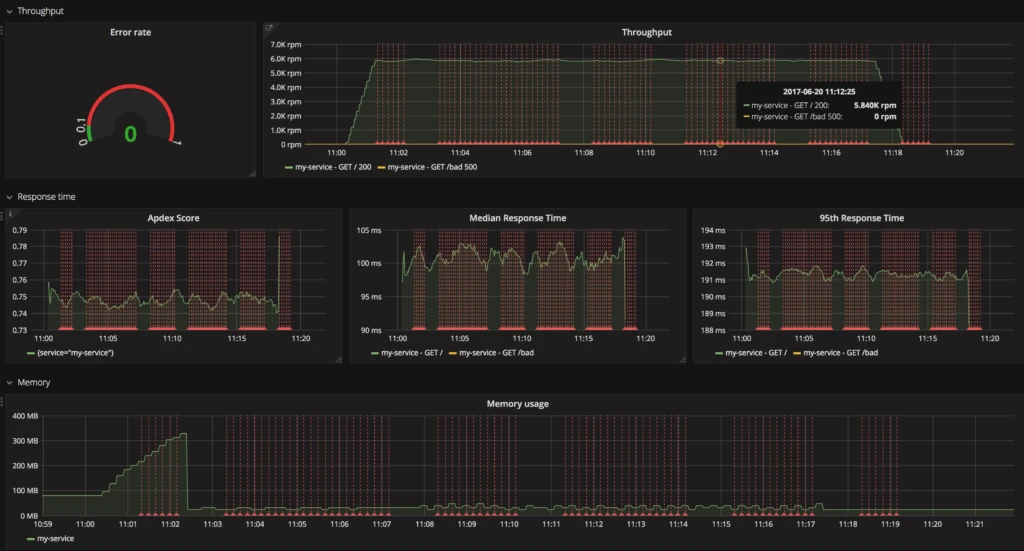
As you can see, the built-in visualization method of Prometheus is great to inspect our queries output, but it’s not configurable enough to use it for dashboards.
As Prometheus has an API to run queries and get data, you can use many external solutions to build dashboards. At RisingStack, one of our favorites is Grafana.
Grafana is an open source, pluggable visualization platform. It can process metrics from many types of systems, and it has built-in Prometheus data source support. In Grafana, you can import an existing dashboard or build you own.

If you want to learn more about Node.js and reliability engineering, make sure to check out the free whitepaper from RisingStack.
At the Node Summit this week? Check out this blog post for ways to the connect with the Microsoft team there.