

Introducing the Agent Governance Toolkit: Open-source runtime security for AI agents
Microsoft unveils the Agent Governance Toolkit to bring OS‑level security, trust, and compliance to autonomous AI agents.

Last December, we released Trill, an open source .NET library designed to process one trillion events a day. Trill provides a temporal query language enabling you to embed real-time analytics in your own application. In this blog post, we spend some time introducing how to get started using Trill.
A key innovation of Trill’s query and data model – which has its roots in StreamInsight and the CEDR tempo-relational model – is the separation of query logic from time management. You’ll find in many temporal systems that time and transformations are tightly coupled. For instance, grouping and aggregation are often combined with windowing into a single operation. In this post, you will see why that is not the case in Trill.
Trill uses snapshot semantics in its data processing. In short, what Trill does is the equivalent of evaluating a standard, atemporal query but at every point in time. For a simple example of what that means, consider the following set of sensor temperature data:
new SensorReading { time = 7:00am, temperature = 70, id = 0 },
new SensorReading { time = 7:20am, temperature = 68, id = 1 },
new SensorReading { time = 7:40am, temperature = 72, id = 2 },
new SensorReading { time = 8:00am, temperature = 76, id = 3 },
new SensorReading { time = 8:20am, temperature = 80, id = 4 },
new SensorReading { time = 8:40am, temperature = 84, id = 5 }
In a standard relational database, if one were to issue this query:
SELECT Avg(temperature) FROM SensorReading
The query runs once, over all data. In this case, the result would be 75, an average of all temperature values. One way to think about this scenario is as if each data value is valid at all points of time – it is always in existence. Graphically:
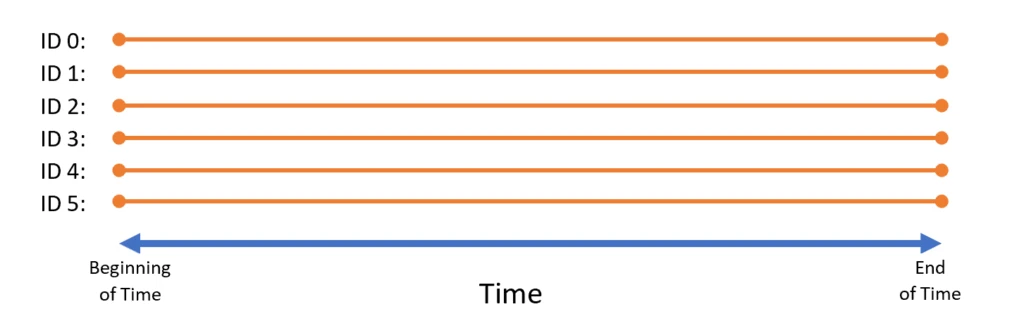
This graphic may be the most boring graphic in the history of blogging, but it gets the point across: a standard relational database in standard query logic is static and does not change. If it does change, a whole new query answer is produced.
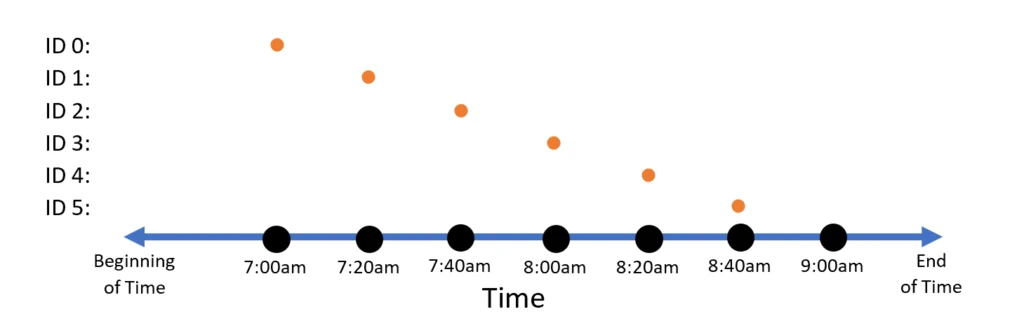
Now, our sample data above is inherently temporal, meaning that what we want does not look like the above diagram, but rather something like this:
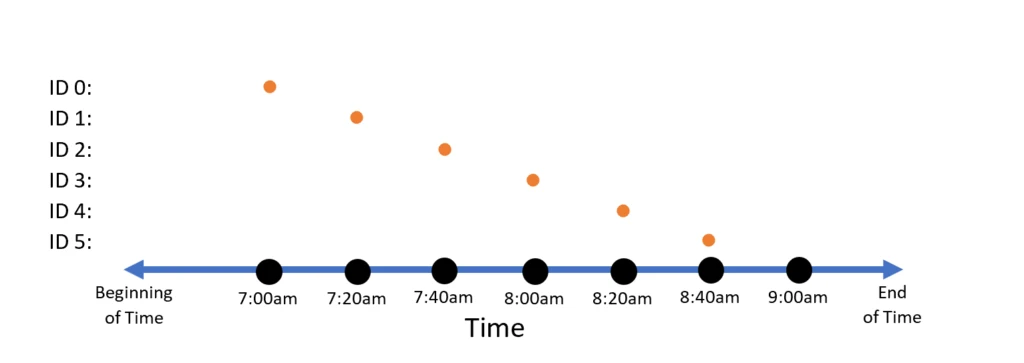
Each data point occurs at a point in time. One can think of this data set as a single data point that comes into existence at 7am, then disappears. Then another at 7:20am, then disappears. And so on.
Trill could still run the same query above on this data. If you do, you will get the following result:
Yes, that’s the same diagram cut and pasted again. The snapshot semantics here say that at time 7am there is only one currently valid data point, and that point has a value of 70. So, the average of all data is 70. Then at 7:20am, the average is 68. At 7:40am, the average is 72. And so on.
That’s not a particularly useful query answer. A more likely scenario would be a tumbling window, where we take the average temperature of all readings in a given hour period. How do we do this in Trill?
The way to think about it is in two steps. First, think about the time periods in the result. For a tumbling window, we’d want one result for the hour from 7am to 8am, and one from 8am to 9am. Second, we want to identify which data points should contribute to the query answer. For the 7am to 8am result, we want to query over data points 0 through 2. For the 8am to 9am result, we want points 3 through 5.
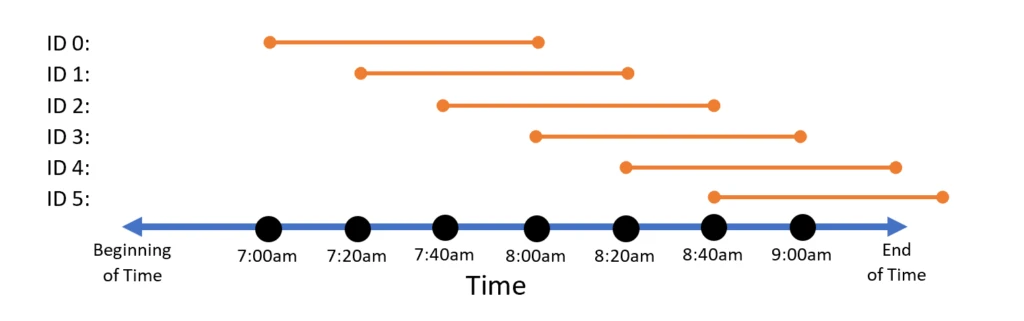
To get the proper result, one must alter the event lifetimes to match the results they contribute to. From the above logic, we want to take point 0 (originally occurring at 7am) and change its lifetime to be 7am-8am. Same with point 1, originally occurring at 7:20am, etc. The desired result is to have a set of lifetimes that looks like the following:
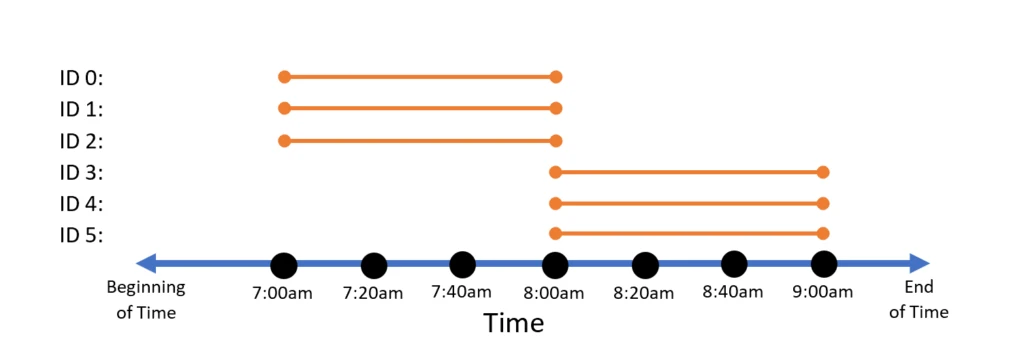
There is a built-in operation that does this in Trill: TumblingWindowLifetime. However, this method is not magic. It calls another, more general method (AlterEventLifetime) that redefines each event’s lifetime by setting its start time and duration. For a tumbling window, the new lifespan has a start time of the original time modulo the window size, and a duration equal to the window size:
Then, when Trill executes our Average query over this new dataset, the result is:
What if we instead have a different pair of functions determining event start time and duration:
With these two functions, we instead get a hopping window of hop size 20 minutes and window size 60 minutes:
Trill has a built-in method for this operation, HoppingWindowLifetime(windowSize, hopSize), but again it is just a helper method that creates the two functions above. By allowing the user to assign lifetimes independently from other operations, Trill opens a window (pun intended) to many possibilities. Consider a situation where the user assigns lifetimes as follows:
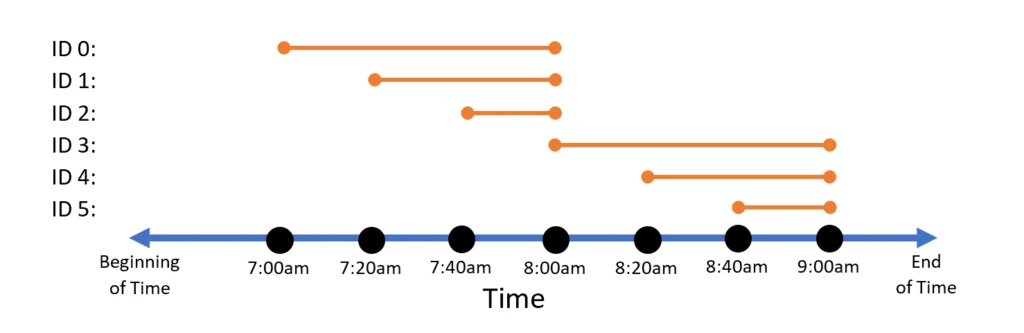
This allocation of event lifetimes provides a progressive tumbling window per hour. One can now, for instance, get the average temperature per hour, but with increasing accuracy over the course of the hour as new data arrives.
These built-in operations are only the tip of the iceberg with window definition in Trill. One can define data-dependent windows, or windows that produce progressive results as more data arrives, and so on.
Anyone familiar with C# will already know Trill’s query logic language: it’s LINQ!
stream.Select(event => …) // Projection
stream.Where(event => …) // Filtration
stream.Join(stream2, o1 => …, o2 => …, (o1, o2) => …) // Join
These methods inherited from LINQ are supplemented by the timespan management methods mentioned in the previous section, along with many others, for instance:
stream.TumblingWindowLifetime(TimeSpan.FromMinutes(5).Ticks)
stream.HoppingWindowLifetime(TimeSpan.FromMinutes(5).Ticks, TimeSpan.FromSeconds(5).Ticks)
stream.SlidingWindowLifetime(TimeSpan.FromMinutes(5).Ticks)
The query operations and the lifetime operations are separate; the query author uses the lifetime methods to state when each event is to contribute to the query answer, and the LINQ methods to evaluate the query itself.
To illustrate, consider a simple example of a stream of data coming from temperature sensors as in the previous section, but now with an added field representing the ID of the sensor taking the reading. The data arrives as an observable stream with this schema:
public struct SensorReading
       { public int sensorId; public double temperature; public long time; }
IObservable incomingData = ...;
We do have one step to take before processing this data, and that is to identify the time dimension in the incoming data. In this simple case, the time for each data point is stored in the time field. We identify that field when we convert this data into an IStreamable, in this case using the built-in extension method ToTemporalStreamable:
var stream = incomingData.ToTemporalStreamable(s => s.time );
There’s a lot going on in that simple method ToTemporalStreamable. For instance, this method is responsible for handling any temporal disorder that may occur in the input data. We will cover the extensive power and expressiveness available in the ToStreamable methods in a later post, but for now just know that once data has been handled by ToTemporalStreamable that data in all subsequent operations will be in time order.
The variable stream above is of type IStreamable, and with it we have all operations available in Trill. Now let’s ask some questions!
Query 1: What is the maximum temperature over all sensors in the building each hour?
var hourly = stream
               .TumblingWindowLifetime(TimeSpan.FromHours(1).Ticks)
               .Max(event => event.temperature);
Notice here that the call to TumblingWindowLifetime in this example and all others is separate from the aggregate and grouping operation. As noted, this separation is not just clever syntax.
Query 2: What is the maximum temperature for each sensor in the building each hour?
var hourlyPerSensor = stream
          .TumblingWindowLifetime(TimeSpan.FromHours(1).Ticks)
          .GroupApply(
              event => event.sensorID,
              data => data.Max(event => event.temperature),
              (group, value) => new { sensor = group.Key, value.temperature }
          );
The GroupApply operation over IStreamable is Trill‘s analog of the Group operation in LINQ combined with an aggregate; it groups data, applies a query to each group, then selects a value from each group. It is, essentially, a Map-Reduce operation.
Query 3: What sensor is reporting the maximum temperature each hour for temperatures exceeding 30 degrees?
var warmRooms = stream
           .TumblingWindowLifetime(TimeSpan.FromHours(1).Ticks)
           .GroupApply(
               event => event.sensorID,
               data => data.Max(event => event.temperature),
               (group, value) => new { sensor = group.Key, value.temperature }
           ).Where(event => event.temperature > 30)
           .Max(event => event.temperature)
           .Select(event => event.sensor);
To see the result of these queries, we need to get data back into a familiar structure like IObservable:
var result = hourlyPerSensor.ToTemporalObservable(
                     (start, end, data) =>
                           new { time = start, data.sensor, data.temperature });
Each result in the observable will be associated with two time points – its start time (when the row becomes valid) and its end time (when it ceases being valid). As this result comes from a tumbling window query, the resulting data will have “start” and “end” times that look like beginnings and ends of hour intervals.
This post covered the very basics of what a Trill query looks like. In future posts (Trill 102 and Trill 103), we will cover some additional features of the API, such as joins, regular expressions, ingress policies, and partitioned timelines. To learn more about Trill, check out our samples repository on GitHub.
Microsoft unveils the Agent Governance Toolkit to bring OS‑level security, trust, and compliance to autonomous AI agents.

From improving reliability and performance to advancing security and AI-native workloads, our goal remains the same: make Kubernetes better for everyone.

DocumentDB Kubernetes Operator enables you to deploy and manage open-source DocumentDB on Kubernetes. Simplify cloud-native database operations today.

Drasi turns one with GQL support—giving developers more ways to build change-driven systems.