
Hyperlight Nanvix: POSIX support for Hyperlight Micro-VMs
The Cloud Native Computing Foundation’s (CNCF) Hyperlight project delivers faster, more secure, and smaller workload execution to the cloud-native ecosystem.

In our last post, Daniel Semedo and I provided an overview of how to add automated performance quality gates using a performance specification file, as defined in the open source project Keptn Pitometer.
In this post, I’ll explain the steps required to add a performance quality gate to your Azure DevOps pipelines for both DevOps “Multi-Stage” and “Classic” pipelines using Keptn Pitometer.
As a quick refresher, Keptn Pitometer is not an application – it’s a set of open source Node.js modules used to create your own Pitometer client. Pitometer provides the processing of a performance specification (PerfSpec). This PerfSpec file defines the metrics, evaluation thresholds, and scoring objectives that constitute the resulting pass, warning or fail status calculated by Pitometer.
The quickest way to try Pitometer is to use the Pitometer webservice. In Azure, this is as simple as starting up an Azure container instance that uses the Pitometer webservice Docker image. This way any pipeline can add a quality gate by just calling webservice with their PerfSpec file. Follow these instructions to create a new container instance through the Azure portal or Azure CLI.
After the container instance is running, go to the overview page (shown below) and copy the IP address. Use this IP within the Pitometer webservice URL: http://<Your IP>:8080/api/pitometer.

The PerfSpec file is tailored to your quality objectives and application. You’ll need to specify the indicator metrics to capture, and the scoring for the “Pitometer” service to evaluate. See example PerfSpec file here.
Once you have your own PerfSpec file, check it into your Azure DevOps or GitHub repository. This allows you to manage artifacts the same way and keep them in-sync with code changes.
A PowerShell script is an easy way to call and parse results from the Pitometer webservice. The example below expects the following parameters and will first read the “PerfSpec” file contents and construct the request to the Pitometer webservice.
After the Pitometer webservice is called, the script will parse the response and pull out the status attribute. The status attribute will have a value of “pass,” “warning,” “fail,” or “error.” If there is a failure or an “error,” the script will return “exit 1” thus stopping the pipeline.
# input variables
$START_TIME=$env:startTime
$END_TIME=$env:endTime
$PITOMETER_WEBSERVICE_URL=$env:pitometerUrl
Set-Variable -Name "PERFSPEC_FILE" -Value "$(System.DefaultWorkingDirectory)/_Demo-App-Build/app/perfspec/perfspec.json"

# read perfspec file contents and compose the Pitometer service POST body content
Set-Variable -Name "PERFSPEC_DIR" -Value "$($PERFSPEC_FILE)"
$PERFSPEC_CONTENT = Get-Content -Path $PERFSPEC_DIR
$PERFSPEC_REQUEST_BODY="{""timeStart"": $START_TIME,""timeEnd"": $END_TIME,""perfSpec"": $($PERFSPEC_CONTENT)}"

# some debug output
Write-Host "==============================================================="
Write-Host "startTime: "$START_TIME
Write-Host "endTime: "$END_TIME
Write-Host "url: "$PITOMETER_WEBSERVICE_URL
Write-Host "request body: "$PERFSPEC_REQUEST_BODY
Write-Host "==============================================================="

# calling Pitometer Service
$PERFSPEC_RESULT_BODY = Invoke-RestMethod -Uri $PITOMETER_WEBSERVICE_URL -Method Post -Body $PERFSPEC_REQUEST_BODY -ContentType "application/json"

# more debug output
Write-Host "response body: "$PERFSPEC_RESULT_BODY
Write-Host "==============================================================="

# save the Pitometer service response and pull out the result status
$PERFSPEC_JSON = $PERFSPEC_RESULT_BODY | ConvertTo-Json -Depth 5
$PERFSPEC_RESULT = $PERFSPEC_RESULT_BODY.result

# evaluate the result and pass or fail the pipeline
if ("$PERFSPEC_RESULT" -eq "fail" -Or "$PERFSPEC_RESULT" -eq "error") {
    Write-Host "Failed the quality gate"
    exit 1
} else {
    Write-Host "Passed the quality gate"
}
Here is how to setup up the PowerShell script inputs.
$startTime = Get-Date ((get-date).toUniversalTime()) -UFormat +%s Write-Host (“##vso[task.setvariable variable=startTime]$startTime”)

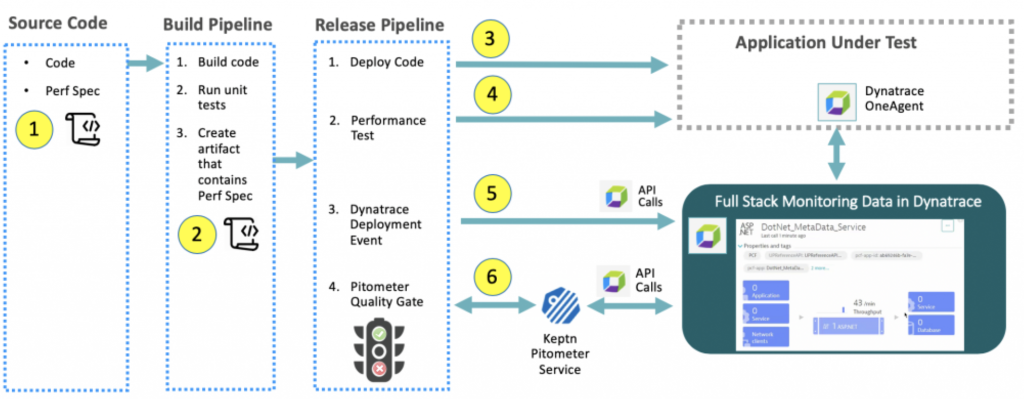
Below is a representative build and release pipeline that includes typical tasks along with the addition of performance quality gate task described in step 6.
Azure DevOps offers both “Classic” pipelines and the new “Multi-Stage” pipelines.
Azure “Classic” has two distinct pipeline types; build and release. Build pipelines can be created using a visual editor or through YAML declarative files, as opposed to release pipelines, which can only be created visually.
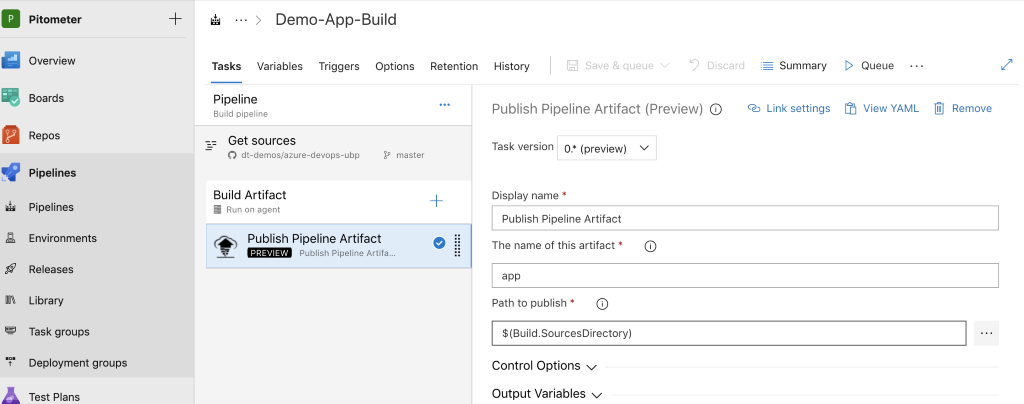
A Build pipeline is meant to build, unit test, and publish a reusable build artifact. Since we checked in our “PerfSpec” file with our code, we can include it in the build artifact and reference it through the Release pipeline.
The example Build pipeline, named ”Demo-App-Build,” will make an artifact named “app” that includes the whole repo, including the PerfSpec sub-folder, which contains the perfspec.json file. The ZIP artifact will be saved with the pipeline release.
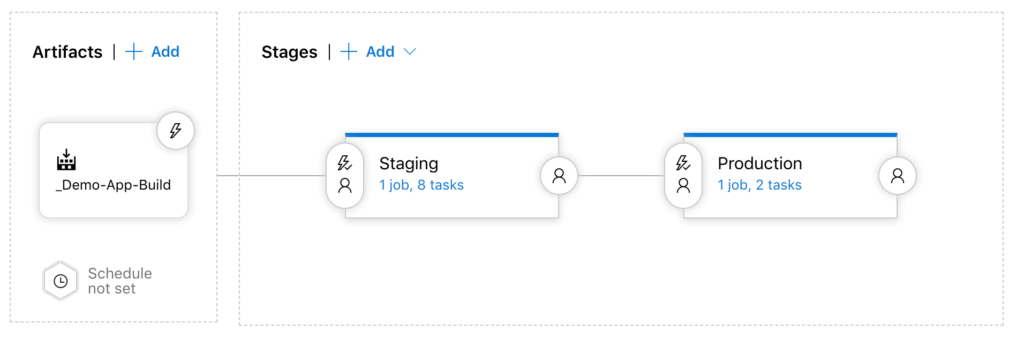
A Release pipeline takes input artifacts and uses their files for task scripts such as deploying code. Tasks are grouped into stages. Below is an example release pipeline named ”Demo-App-Deploy” with two stages named “Staging” and “Production.”
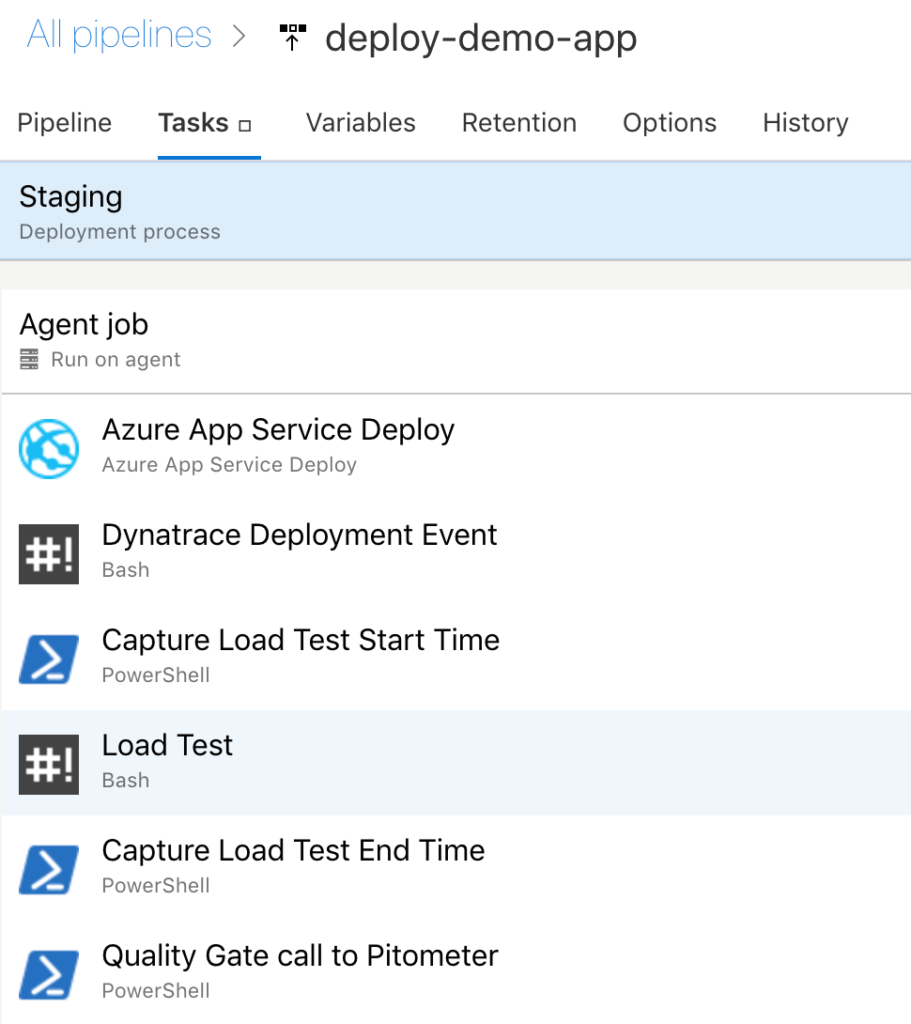
Below are the tasks within the ”Staging” stage. The last one is the PowerShell “Quality gate call to Pitometer” task, which determines if the pipeline stops or continues to the “Production” stage.
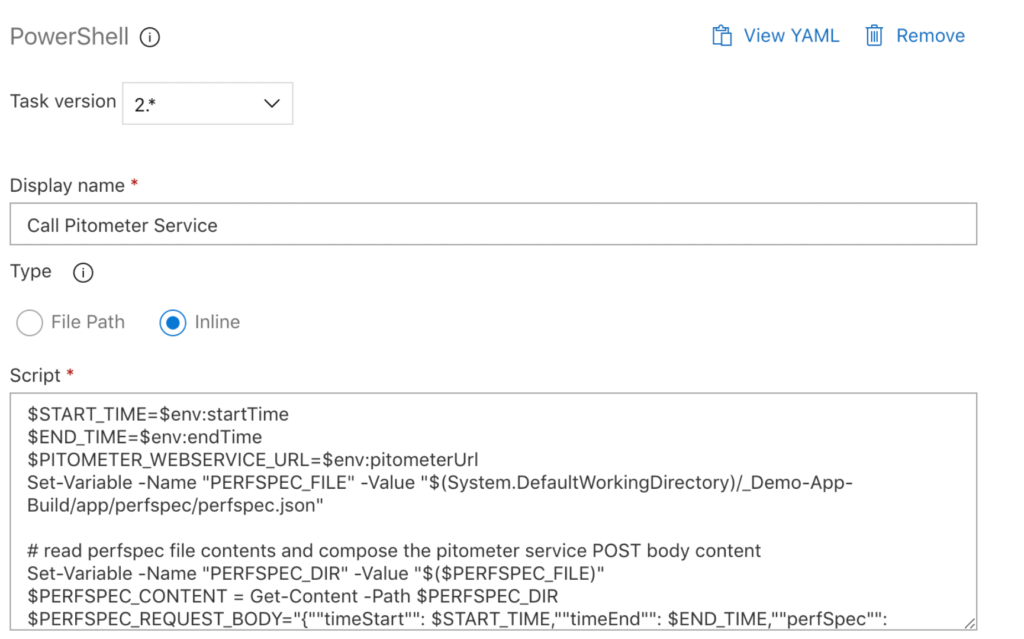
The “Quality gate call to Pitometer” task simply contains the PowerShell script we reviewed earlier as an in-line script (shown below). Recall that the script will ”exit 1” and stop the pipeline when the “PerfSpec” fails.
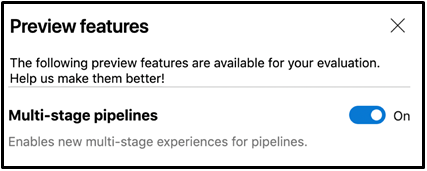
Azure DevOps “Multi-Stage” pipelines allow all the build and release tasks to be defined in a YAML file. To enable this preview feature, open the menu found within your Azure DevOps account profile as shown below.
We need to capture the test start and stop times, run a performance test so that monitoring metrics are collected, and run the quality gate step. Similar to Classic pipelines, PowerShell tasks can be run as either in-line scripts or script files.
Below is a YAML pipeline code snippet for PowerShell tasks calling scripts files.
- task: PowerShell@2
displayName: 'Capture Load Test Start Time'
failOnStderr: true
inputs:
    targetType: filePath
    filePath: $(System.DefaultWorkingDirectory)/extract/pipeline/captureStartTime.ps1

- task: Bash@3
displayName: 'Load Test'
inputs:
    targetType: filePath
    filePath: $(System.DefaultWorkingDirectory)/extract/pipeline/loadtest.sh
    arguments: 'Staging $(azure-resource-prefix)-ubp-demo-app-staging.azurewebsites.net $(loadtest-duration-seconds)'

- task: PowerShell@2
displayName: 'Capture Load Test End Time'
failOnStderr: true
inputs:
    targetType: filePath
    filePath: $(System.DefaultWorkingDirectory)/extract/pipeline/captureEndTime.ps1

- task: PowerShell@2
displayName: 'Quality Gate call to Pitometer'
inputs:
    targetType: filePath
    failOnStderr: true
    filePath: $(System.DefaultWorkingDirectory)/extract/pipeline/qualitygate.ps1
    arguments: '$(startTime) $(endTime) $(pitometer-url) /home/vsts/work/1/s/extract/$(perfspecFilePath)'
Both “Classic” and “Multi-stage” pipelines show a visualization as the pipeline runs and the logs from each task can be reviewed. Below is how the visualization looks for Multi-stage” pipelines and examples for the failed quality gate.

Passing quality gate in “Multi-stage” Pipeline.

Failing quality gate in “Multi-stage” Pipeline.

As with most things within software, there are often several ways to achieve a given goal. I hope these five steps will provide a starting point for implementing automated performance quality gates using Keptn Pitometer within Azure DevOps pipelines.
Questions or feedback? Let me know in the comments below.